Tagged in Akuko
Modern technology to educate millions of children with Imagine Worldwide
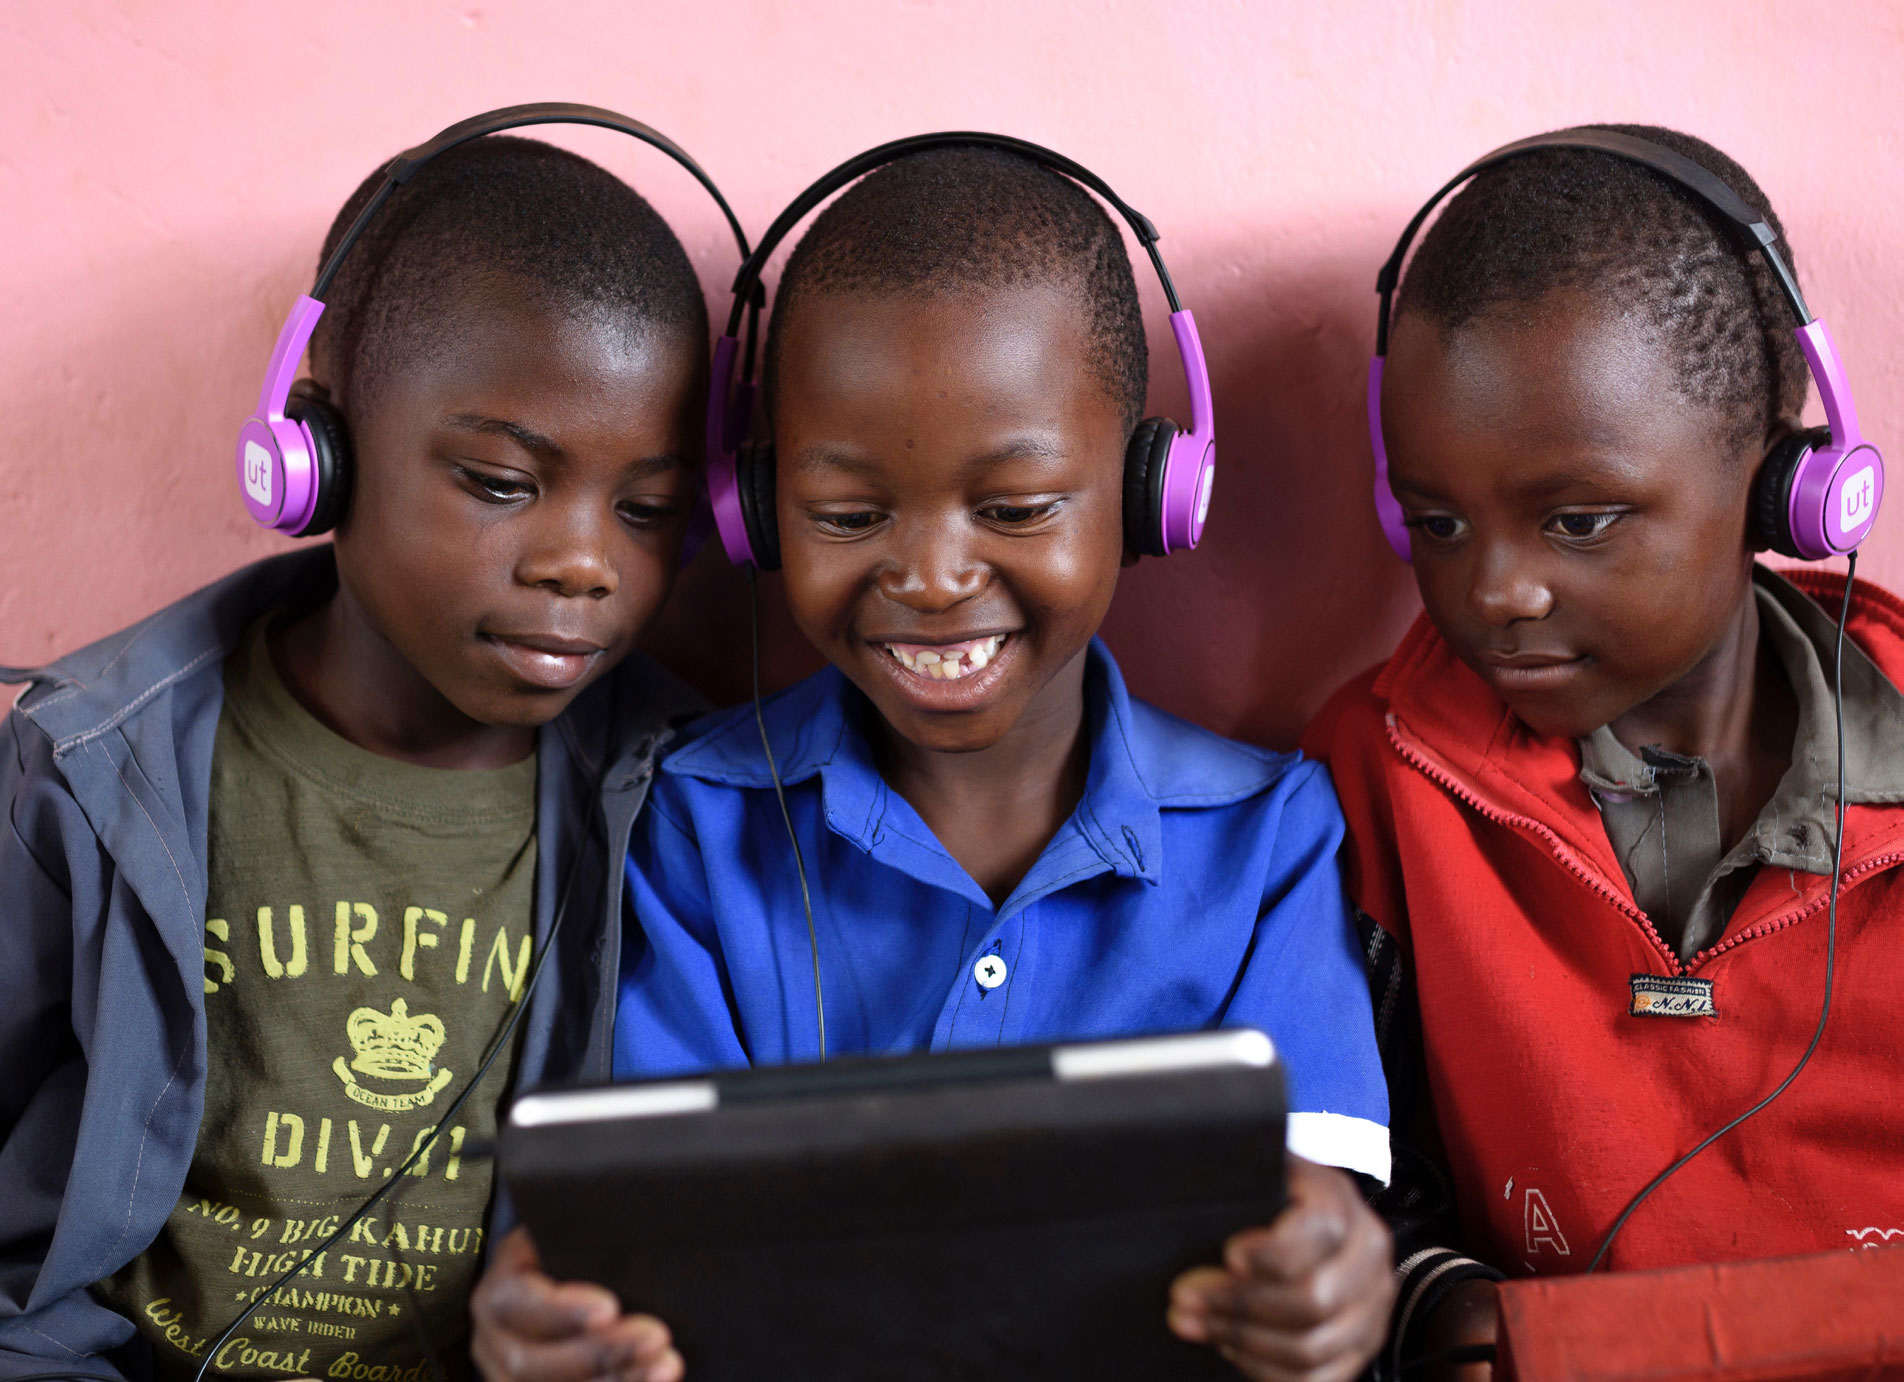
We’re excited to partner with Imagine Worldwide, an award-winning NGO offering e-learning to children in the most underserved areas. Imagine collaborated with Ona needing to combine data from the field with data from other systems and from the tablets themselves. They engaged Ona’s Data Solutions services to create a fit-for-purpose Management Information System (MIS) that could organize all their data and create actionable reports for program teams.
Supporting UNICEF's evaluation of climate change commitments using Akuko
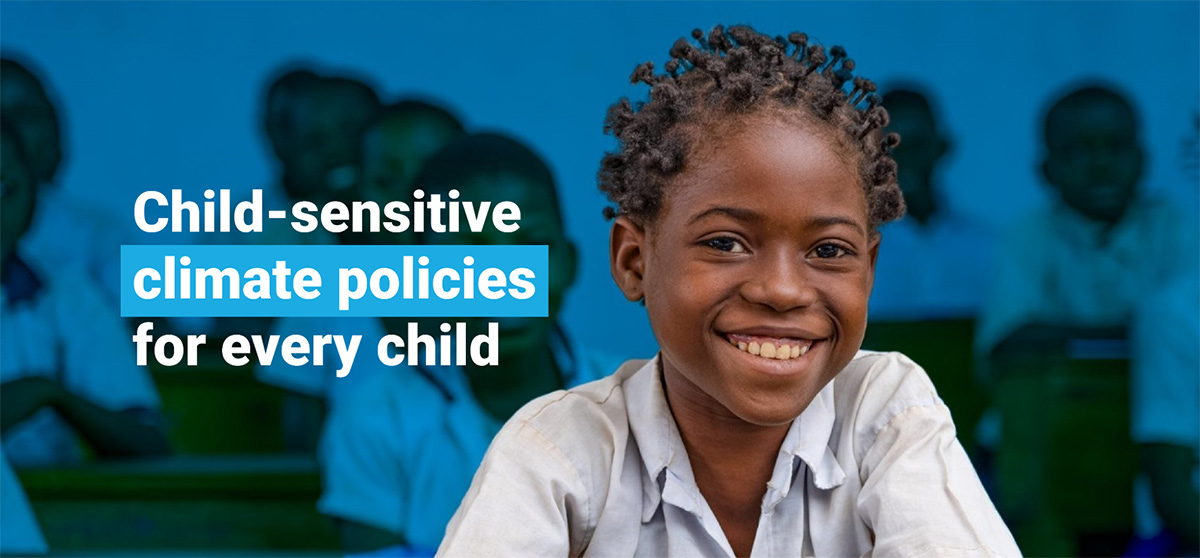
Today’s children and young people will be the most affected by a changed climate, so it is crucial for them to be central stakeholders of climate policies. Recognizing this need, UNICEF set up an evaluation of countries’ climate change commitments, the National Determined Contributions (NDCs), to determine whether commitments in the plans are child-sensitive.
Jenn's Akuko Experience
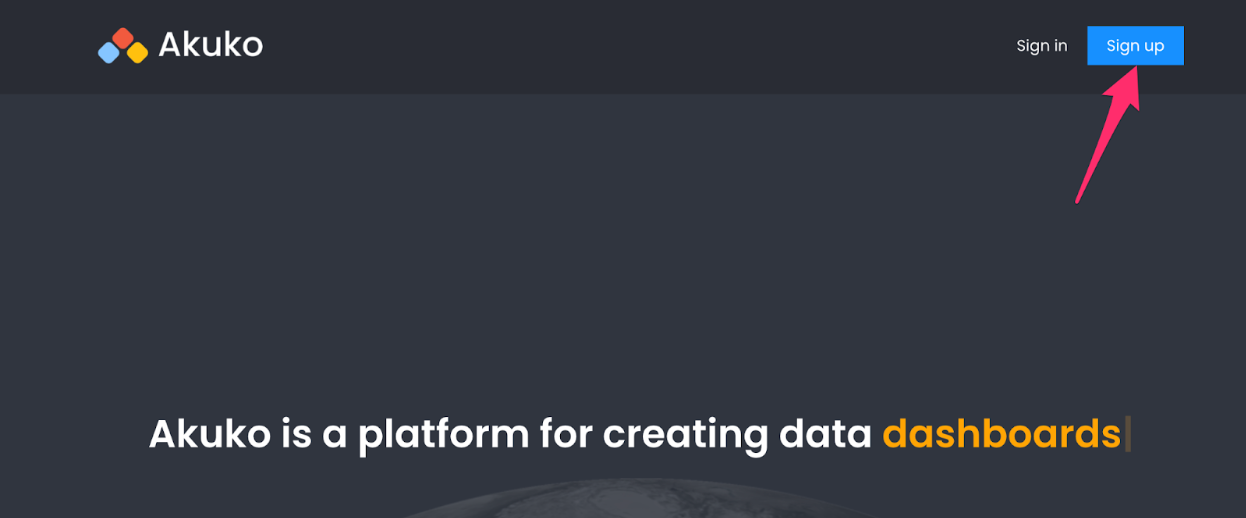
My experience with Akuko as a novice data nerd has been awesome. Signing up on the Akuko website was a breeze as was playing around with the preexisting sample posts that showcase vital information such as colorful maps, charts, and tables. Health data, global population data, and indices are brought to life on the platform.
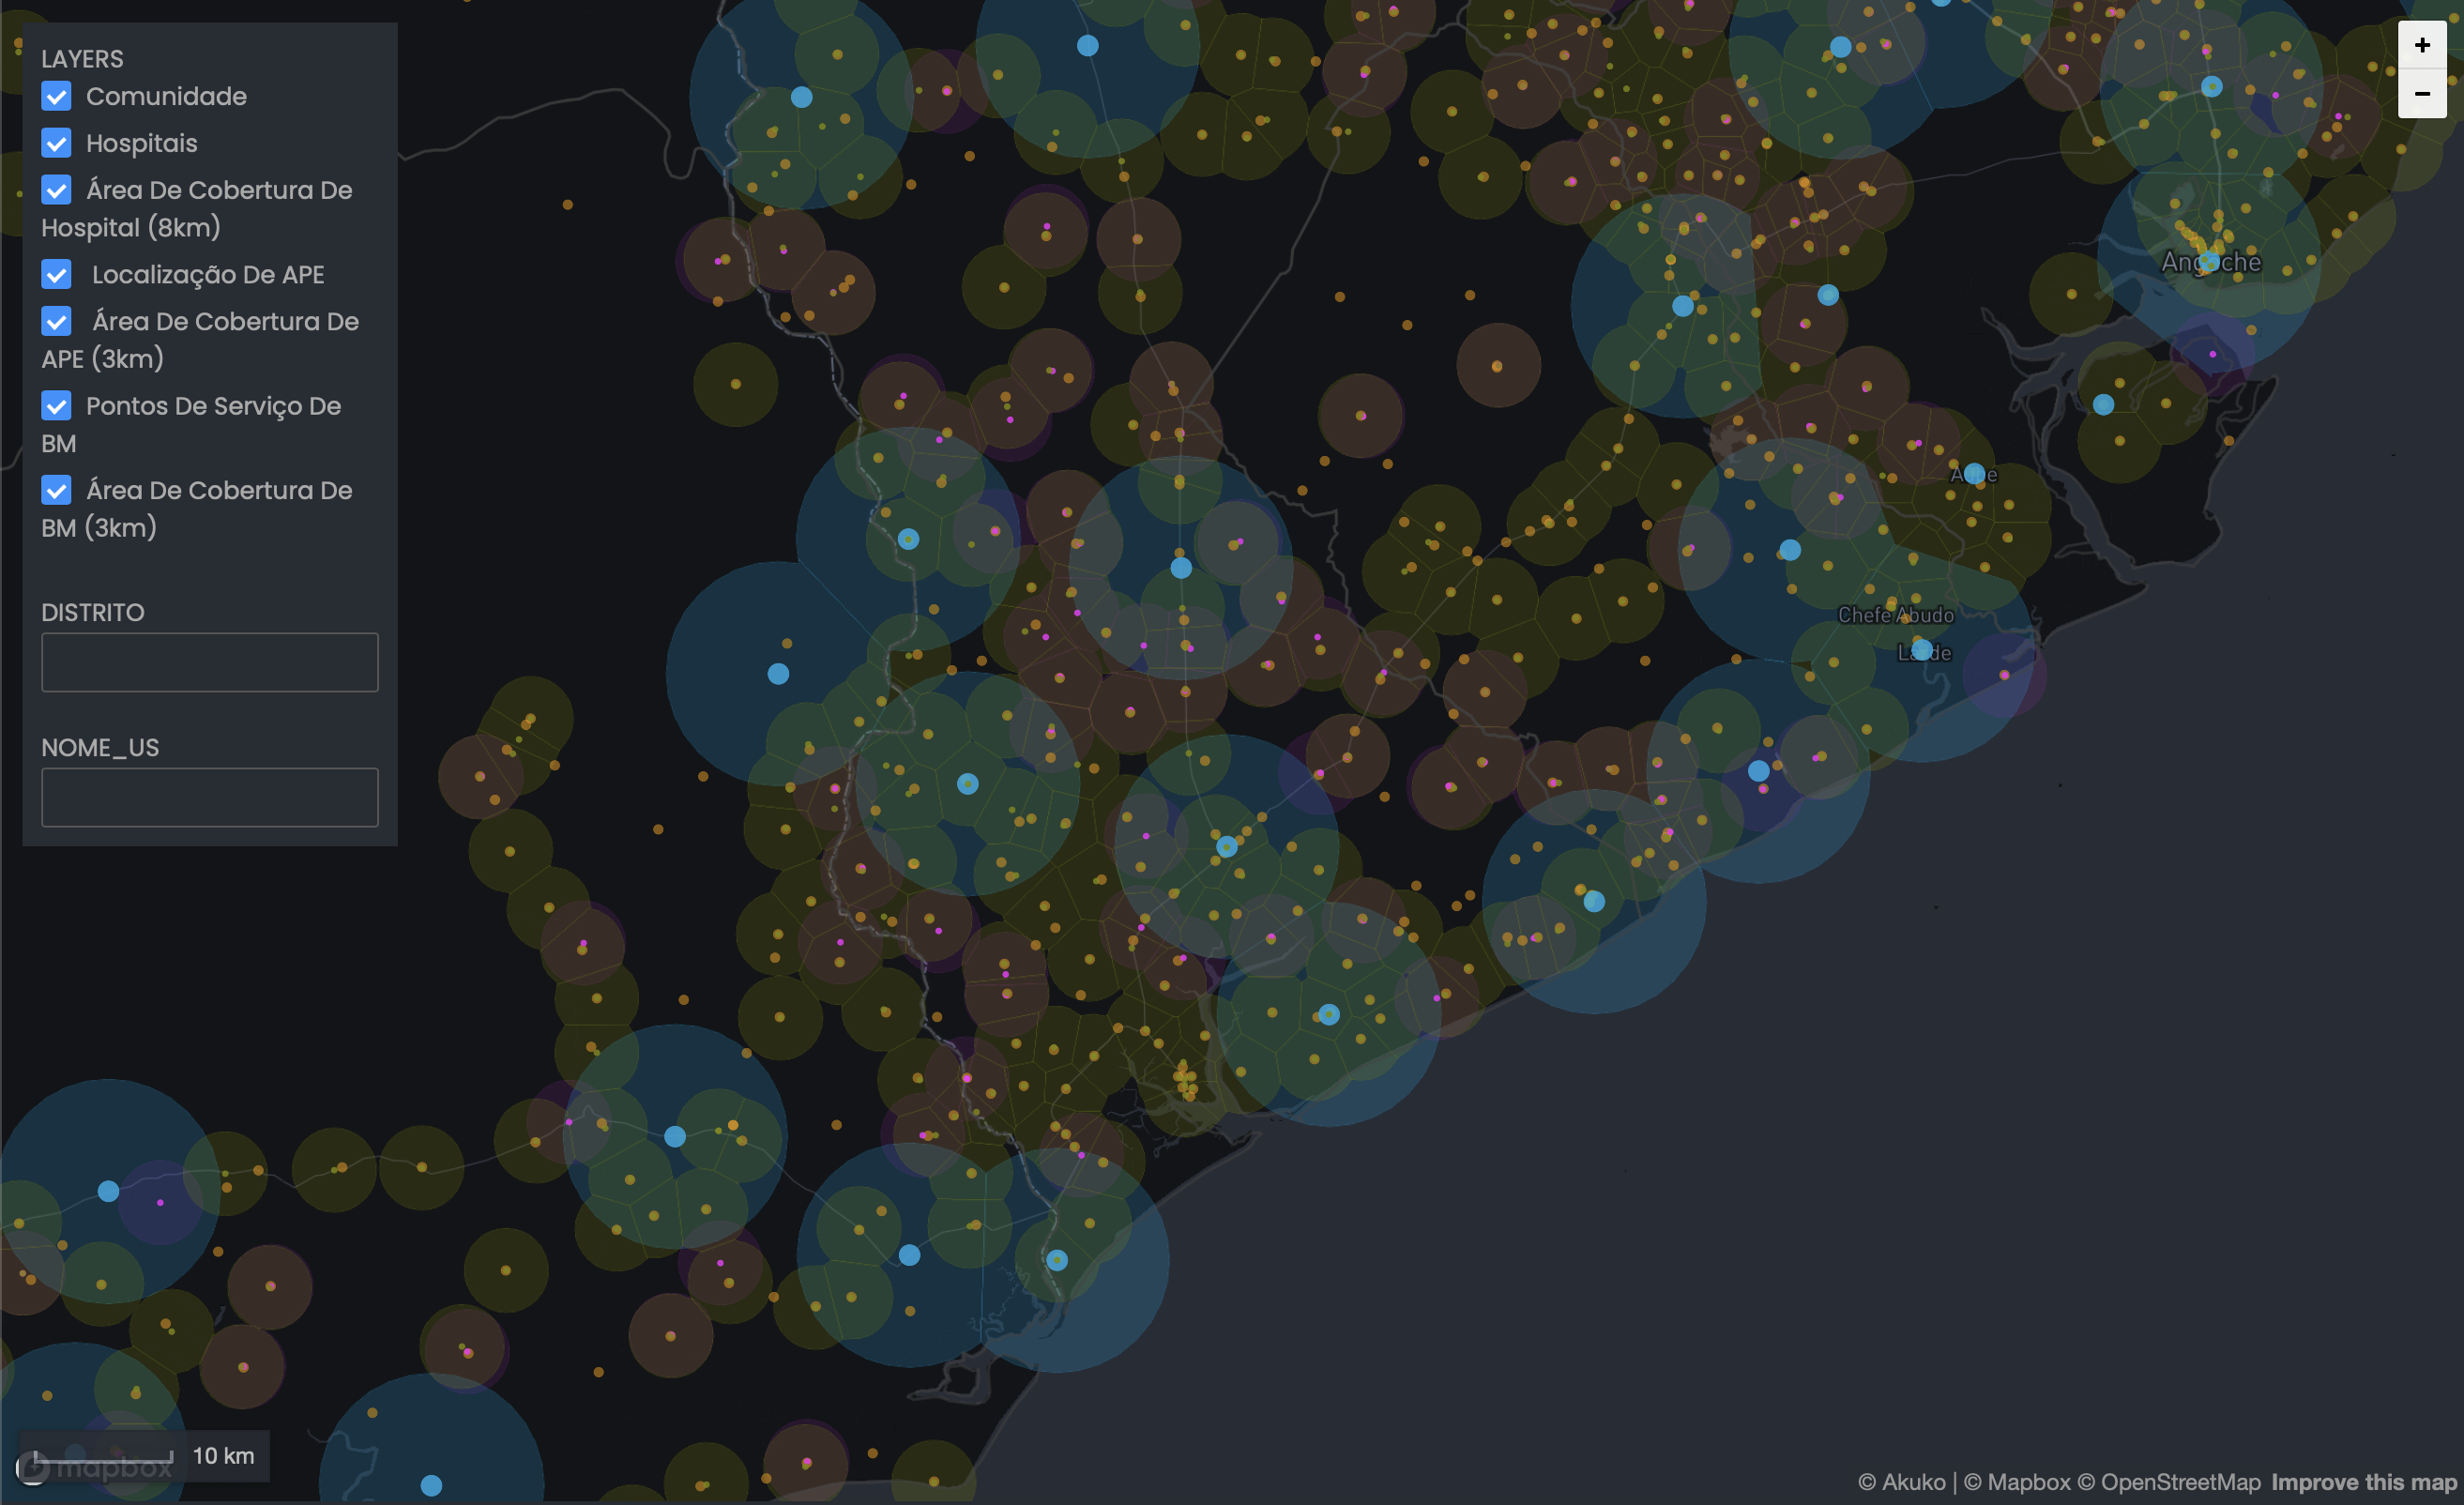
Isochrones: working with Mapbox to improve access to immunization services
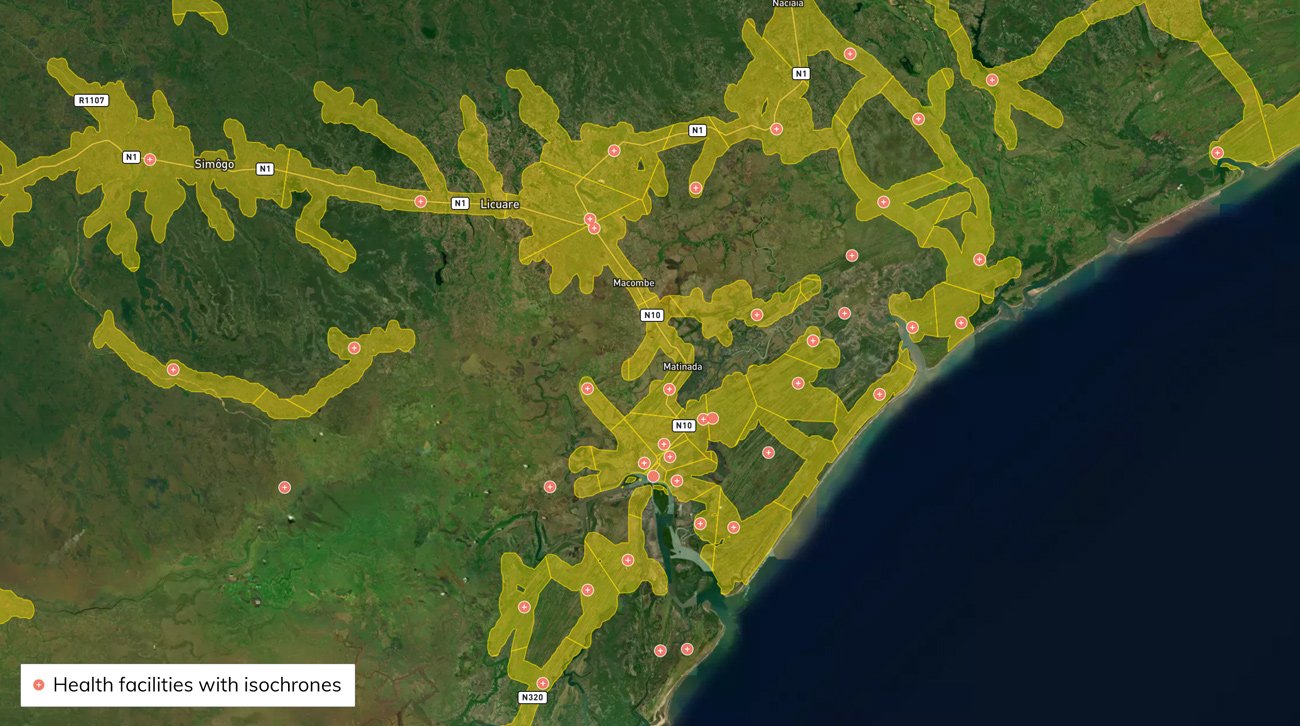
Geospatial analysis is fundamental to our work at Ona. Whether helping organizations see where they collect data, understanding where to send malaria spray teams, or assessing the impact of a cyclone, we often focus on novel applications of mapping technology for our humanitarian partners.
Introducing Akuko!
We’re excited to announce the launch of a new product called Akuko. Akuko is a data storytelling platform that makes it easy to build interactive maps, charts and tables, from different data sources and combine them with photos and narrative text to tell a story with data.