How Forest Carbon uses Ona with R to automate analysis and feedback
We are pleased to share a guest blog post written by Sebastian Persch, Ph.D. who is doing inventive work combining Ona with custom R code.
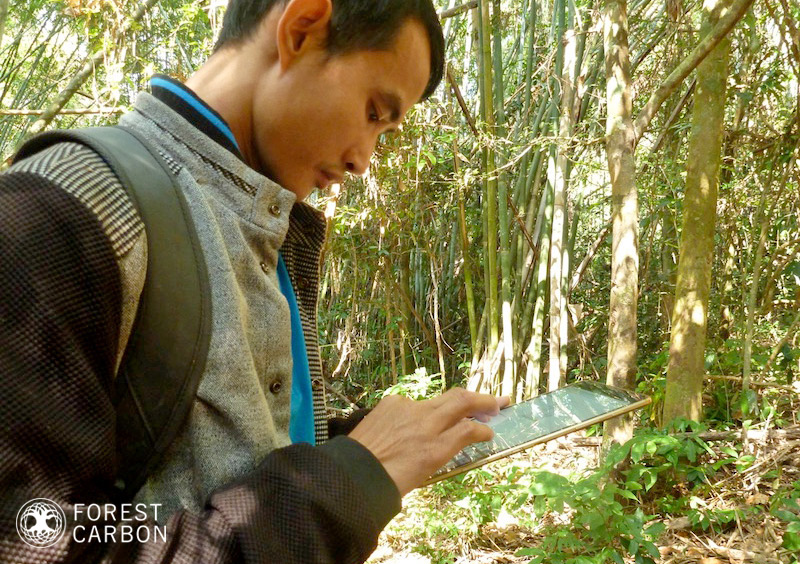
 A member of the field team in Laos, collecting data about smallholder farmers. Image courtesy of Forest Carbon.
A lot of people who use Ona for surveying probably know this feeling: You created a survey, did a lot of interviews or measured stuff in the field, downloaded the dataset from the cloud… and then the tedious struggle begins, i.e. the data analysis and subsequently the report writing. Granted, we did not find the “Holy Grail”, but we would like to share two examples of what is possible to improve your quality control, productivity, efficiency, and possibly make your life a little bit easier.
Who are we? We are Forest Carbon, an environmental consultancy and project development firm. We have been specializing in forest emission reduction projects, forest inventories, carbon accounting, High Carbon Stock assessments, drone surveys, satellite mapping, and capacity building. Combined, we have over 35 years of experience in the environmental sector, and have conducted over 120 consultancies across Southeast Asia, Africa, and Latin America since 2007.
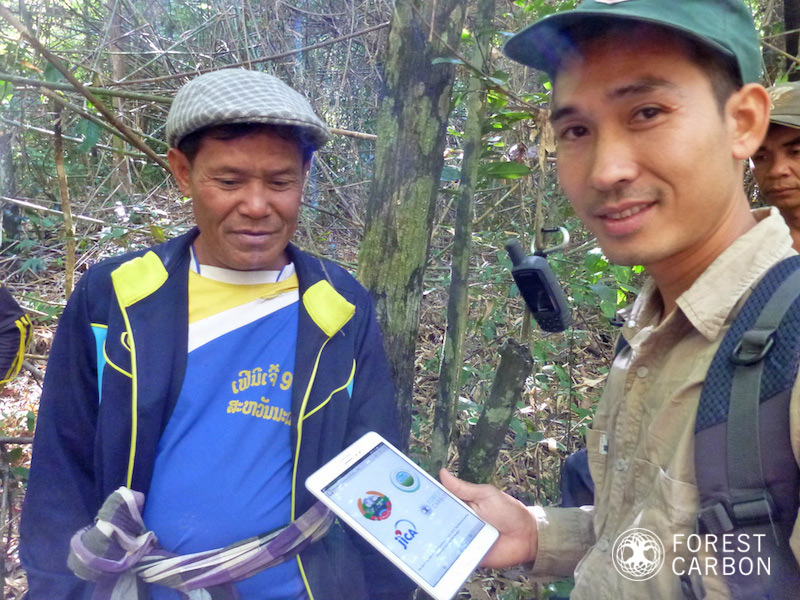
One of our current project’s objectives is to give technical assistance to the government of the Lao People’s Democratic Republic to carry out their second National Forest Inventory. This is supported by the Japanese government through the Japan International Cooperation Agency. Laos is challenged by both low national technical capacities as well as a highly dynamic vegetative landscape. As you can imagine, such a nation-wide inventory involves a lot of teams on the ground going to remote places and measuring a lot of trees. In order to be more efficient and improve data quality, we decided to use Ona to create a tablet-based survey. This reduced the time spent and errors created compared to the previous system of paper-based surveys, almost all of which occurred when manually transferring data from paper into spreadsheets. Additionally, the new process was less error prone because data was readily downloadable from the Ona cloud. Another huge advantage was the multiple language feature in Ona, which let us display the survey in different languages. This made it much easier for teams speaking different languages.
 Collecting data for the National Forest Inventory in Laos. Image courtesy of Forest Carbon.
While the data collection process was good, we thought we could take this another step further by using script-based-analysis to automate a part of the data analysis. Luckily, Ona already had a package for R, called ona.R, which makes pulling data into R super easy. So we designed a script that pulls the data every day from the cloud, creates summary statistics and provides a progress update, including how many plots were sampled and the latest carbon stock estimates for the different types of forest sampled. This is then sent by email to all responsible persons, which is done automatically by the script using the package mailR.
Just imagine: you are having breakfast and you come to think of how the surveys are progressing. All you have to do is check your email and all your worries are gone.
Ona to R Example Web Report
Since our Ona to R stories might sound too good to be true, we made the Ona to R Example Web Report to show what scripts look like in practice and how they can make life a little bit easier.
How to use the web report:
When you go to the Ona to R Example Web Report website, you’ll see farming report data such as countries where data is coming from, the most frequently planted crop, and basic stats on field size. The report automatically reflects the current data submitted by the example survey, which is accessible via the “here” link on the bottom of the page. To update the data that feeds the report, fill out and submit the survey, then refresh the app page. The report will update to reflect the new data. The Download button lets you download the report as a PDF file.
So what’s going on technically? Peter, from Ona, explains: This example web report uses the Ona.R integration, which allows you to write R code that fetches your most recent survey data directly from Ona. By hosting his R script on a website, Sebastian created a web report whereby simply loading the web page gives him the latest analysis run against up-to-date data.
Another one of our projects is supporting the development of a Social and Environmental Impact Assessment (SEIA) for smallholder farmers. In most cases these farmers have limited capacity to carry out such surveys, yet it is a requirement for them to be certified for their crop. Conducting the survey, transcribing the data collected into spreadsheets, and then writing the report, which has to follow a precise format, is likely to be a very tedious process. Imagine all the potential errors, the time it takes to get them to submit the report, all the back and forth, and the frustration of all the participants in this process! So we figured, the easiest way to do this is using Ona surveys to facilitate the data entry, and then using an R-script to do the analysis and the report writing. We designed an app, using Shiny and R Markdown, both developed by RStudio, to create this workflow.
Now the smallholders can carry out the survey on their smartphones, upload the data, and with the press of a button, have the required report in the exact format ready to be submitted. The multiple language feature comes in handy here as well. Enumerators in the field used a local language to enter data, but we wanted to have the report not only in that language, but also in English. That is an easy thing to do, because all questions are linked to the answers in the languages you wrote prior to the survey. Imagine it like a spreadsheet, where the questions are in the first columns (in the different languages), and the answers in the languages needed are in the subsequent columns. All you have to do is select the languages you need the report written in, and the script will know where to find the answer.
If you’re interested in using Ona.R in your project, please email biz@ona.io. We’re also excited to hear of the innovative ways our users enhance the platform to make life easier. How are you using Ona? Let us know! Email press@ona.io, tweet us or post on our Facebook wall.
Guest author:
![]()
Mr. Persch is a tropical ecologist with a background in tropical and international forestry. He has worked on various topics related to forestry, conservation, and climate change mitigation for the past 5 years. He conducted research on peatlands in Sumatra, Indonesia on carbon stock and carbon dynamics estimations in association with CIFOR, CIRAD, the James Hutton Institute and the University of Göttingen, gaining in depth knowledge on tropical carbon cycles and climate change mitigation efforts.
In his current position as an independent consultant, and through his deep knowledge in advanced data analysis and statistical programming, he helps Forest Carbon to automate the data analysis of the pilot project for the national forest inventory of Lao PDR, as well as implementing the analysis for the 2nd national forest inventory in Laos. Furthermore, he advised Forest Carbon on feasibility studies for REDD+ projects in Central Kalimantan, Indonesia and Jambi, Indonesia.