Plotting Real-Time Locations with Mapbox
In this post we will leverage Mapbox’s real time live data plotting abilities to track the International Space Station (ISS) location on a map in real time. Real-time mapping and geolocation tracking is a core feature for web and mobile applications across many industries. In simpler words, this feature detects and streams location data to a live map, and shows the location update as it changes in the real world.
We will build a Node.js Express backend, which streams the live data from wheretheiss.at, then proceed to instantiate a map and render the ISS’s position on the map in real time.
Prerequisites
Before getting started you will need to have node installed on your machine, as well as basic JavaScript knowledge. You’ll also need to have basic knowledge of the Node.js Express web framework.
Project Setup
For any Ubuntu-based distribution, you can type these commands in your CLI to set up your working directory and install node.
mkdir iss-location && cd iss-location

# Enable the NodeSource repository
curl -sL https://deb.nodesource.com/setup_10.x | sudo -E bash -

# Install Node.js and npm
sudo apt install nodejs
# confirm node is installed by checking the version
node -v
v12.3.1
As you can see, we’ll be building our app in our new iss-location directory.
Initializing the App
To initialize the app we will need a package.json file. The simplest and fastest approach is to generate this with npm (the node package manager). When prompted for your “entry point” enter app.js, which we will create below.
npm init
Now let’s use npm to install the packages we need to help us build the functionalities for our app.
# web framework for node
npm i express
# turns geo data to GeoJSON
npm i geojson
# HTTP-client
npm i request
Your package.json file should look similar to this.
{
    "name": "realtime-map",
    "version": "1.0.0",
    "description": "Real time location map mapbox app",
    "main": "app.js",
    "scripts": {
        "start": "node app.js",
        "test": "echo \"Error: no test specified\" && exit 1"
    },
    "author": "Simon Makonde",
    "license": "ISC",
    "dependencies": {
        "express": "^4.17.1",
        "geojson": "^0.5.0",
        "request": "^2.88.0"
    }
}
Building the App
Our package.json file shows the app.js entry point file, let’s create this file and add some code.
/* Express application which serves the root route and provides an API to get
   current ISS coordinates in GeoJSON format.
 */

var request = require('request'),
    geojson = require('geojson'),
    express = require('express'),
    path = require('path');

var ISS_URL = "https://api.wheretheiss.at/v1/satellites/25544";

var app = express();

app.set('port', (process.env.PORT || 5000));

app.use(express.static(__dirname + '/public'));

app.get('/', function(req, res) {
    res.sendFile(path.join(__dirname + '/index.html'));
});

app.get('/findiss', function(req, res) {
    request(ISS_URL, function(err, resp, body) {
        if (err) {
            console.log(err);
            res.status(400).json({ error: 'Unable to contact ISS API' });
            return;
        }

        var apiResponse = JSON.parse(body);
        var issGeoJSON = geojson.parse([apiResponse], { Point: ['latitude', 'longitude'] });

        res.json(issGeoJSON);
    });
});

app.listen(app.get('port'), function() {
    console.log("App listening on port " + app.get('port'));
});
The code above handles routing. The default route, /, sends a file index.html which will load the HTML and the respective div where the map will be. The other route, /findiss, makes a request to the whereistheiss endpoint, converts the data into GeoJSON format, and returns that to the map. We will use this data to render a layer on a map.
The default route loads an index.html file which we haven’t created yet. Let’s jump in and create this file. Inside your iss-location directory add an index.html file with the following code.
<!DOCTYPE html>
<html lang="en">

<head>
    <meta charset="UTF-8">
    <meta name="viewport" content="width=device-width, initial-scale=1.0, maximum-scale=1.0, user-scalable=no" />
    <title></title>
    <link rel="stylesheet" href="https://api.mapbox.com/mapbox-gl-js/v0.42.1/mapbox-gl.css">
    <style>
        body {
            margin: 0;
            padding: 0;
        }

        #map {
            position: absolute;
            top: 0;
            bottom: 0;
            width: 100%;
        }

        #details {
            position: fixed;
            height: 200px;
            background: transparent;
            color: cadetblue;
            padding-left: 20px;
            top: 50px;
        }

        #details .title {
            color: slategray;
            font-size: small;
        }

        #locate {
            position: fixed;
            left: 20px;
            top: 10px;
        }
    </style>
</head>

<body>

    <div id="map"></div>
    <button id="locate">Locate ISS</button>
    <div id="details"></div>

    <script src="https://api.mapbox.com/mapbox-gl-js/v0.42.1/mapbox-gl.js"></script>
    <script src="src/js/main.js"></script>
</body>

</html>
In this file we import the mapbox-gl CSS and JS. We also load a static file main.js that instantiates a map instance that is loaded inside the div with id map. The main.js file will be responsible for loading the map and rendering a data-driven rocket icon on the map. Let’s create the main.js file and add our code.
mapboxgl.accessToken = '<add your access token here>';
var map = new mapboxgl.Map({
    container: 'map',
    style: 'mapbox://styles/mapbox/dark-v9',
    center: [0, 0],
    maxBounds: [
        [-180, -85],
        [180, 85]
    ],
    zoom: 1
});

var url = '/findiss';

map.on('load', function() {

    window.setInterval(function() {
        fetch(url).then(function(response) {
                return response.json();
            })
            .then(function(json) {
                var data = json,
                    issLastSeen = data.features[0].geometry.coordinates,
                    details = data.features[0].properties,
                    resultingDOM = "";
                for (var prop in details) {
                    resultingDOM += "<span class='title'>" + prop.toUpperCase() + "</span>" + " " + details[prop] + "</br>";
                }

                document.getElementById('details').innerHTML = resultingDOM;
                document.getElementById('locate').setAttribute("data-coordinate", JSON.stringify(issLastSeen));

                map.getSource('iss').setData(data);
            })
            .catch(function(error) {
                console.log(error);
            });

    }, 1000);
    console.log(url);
    map.addSource('iss', { type: 'geojson', data: url });
    map.addLayer({
        "id": "iss",
        "type": "symbol",
        "source": "iss",
        "layout": {
            "icon-image": "rocket-15"
        }
    });

    map.addControl(new mapboxgl.FullscreenControl());

    document.getElementById('locate').addEventListener('click', function(e) {
        var lastSeenLocaton = JSON.parse(this.getAttribute('data-coordinate'));
        map.flyTo({
            center: lastSeenLocaton
        });
    });

});
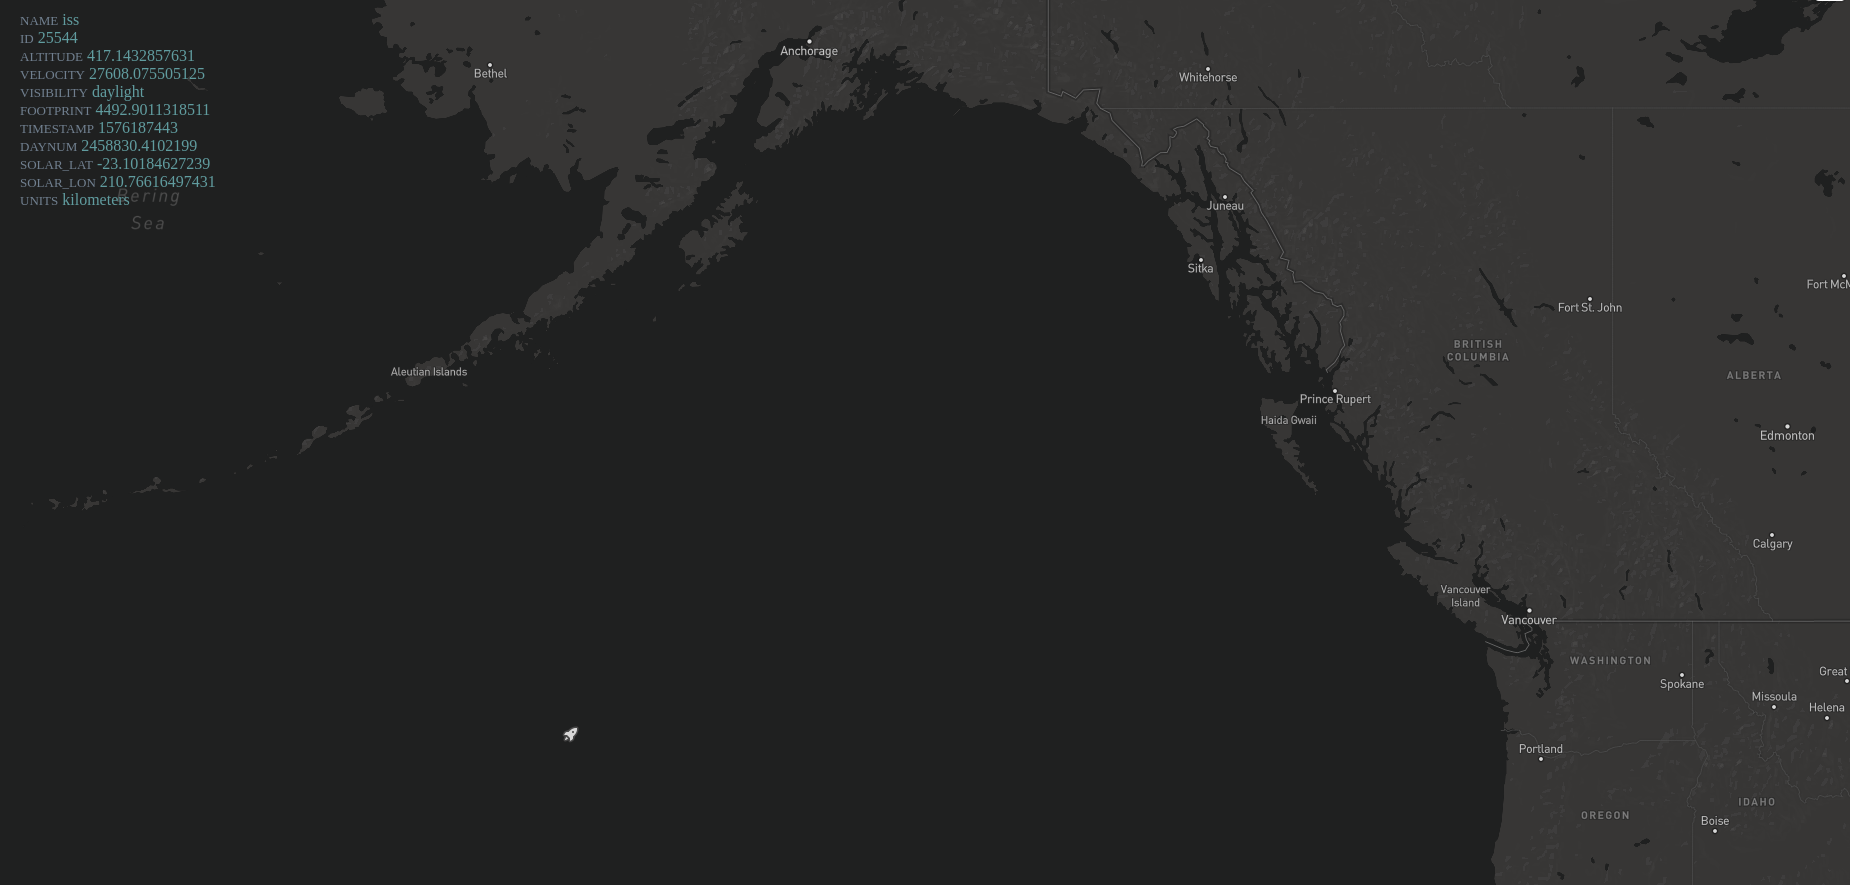
The main.js file handles most of the logic. It instantiates a new map instance and loads data from the API once per second. The code is also responsible for adding the symbol layer spec (the rocket on the map) which is re-rendered each second to show the current location of the ISS on the map.
With our app set to run on port 5000, let’s start the server so we can see where the ISS is in real time.
npm start
> realtime-map@1.0.0 start /home/kahama/realtime-map
> node app.js

App listening on port 5000
As you can see, it works just fine.
Thank you for your time and patience. It’s really amazing what we can do with real-time open data and open source tools. Hopefully this will inspire you to create your own real-time visualizations!