Using AI to estimate and target immunization coverage with True Cover
What is True Cover?
Ona created True Cover, a methodology and set of tools that combine high-resolution satellite imagery, spatial sample modeling methods, and lightweight mobile data collection, to enable health facility staff to more accurately calculate coverage for their catchment area. The type of coverage is flexible — it can be the coverage of up-to-date and fully immunized children or adults, mothers receiving fully antenatal care, the distribution of prophylactic malaria medications, or any other metric. This modeling technique lets health implementers use AI to target their services towards the poorly covered areas and households in their community that can benefit the most from increases in coverage.
Developing the True Cover algorithm
To develop True Cover, we talked to statistical sampling experts and spatial modelers in order to explore different approaches to this problem. We initially planned to use random cluster spatial sampling, an approach commonly used to fill in missing spatial data. In a previous partnership with a university research team, we had successfully used random cluster spatial sampling to conduct a national water point verification exercise with the government of Tanzania. However, while powerful in the hands of trained statisticians, this approach requires considerable expertise to interpret, and discipline in what data to collect and how to use it. Additionally, using data only from sample and replacement points limits the ability to benefit from the full set of coverage data collected.
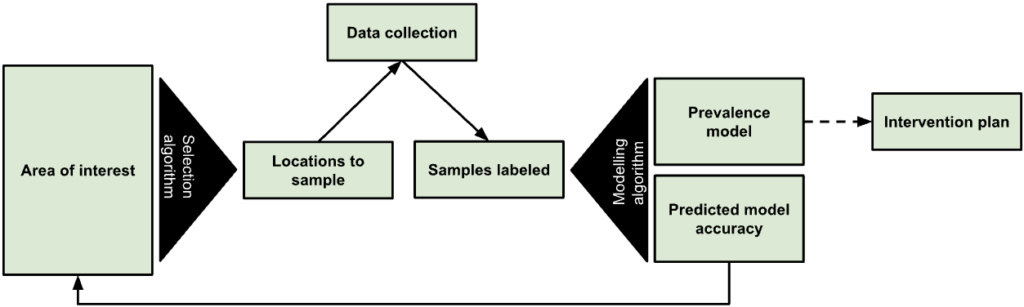
Figure 1: The True Cover algorithm chooses samples from an area of interest to collect data against, then based on the output model’s predicted accuracy recommends additional points to sample.
We expect that many local health teams would struggle to follow the rigor such an approach requires, and wanted to find an approach that let us leverage as much of the existing data as possible. In discussions with Dr. Hugh Sturrock, an epidemiologist at UCSF who we are collaborating with on malaria elimination work, we realized we could leverage a set of spatial modeling approaches he developed to help predict the prevalence of neglected tropical diseases (NTDs) and malaria in populations. Following these discussions, we partnered with Dr. Sturrock to develop, test, and create the True Cover algorithms and build a web service around them.
The True Cover algorithm works by taking as an input observations of service coverage at specific spatial locations (defined by a longitude and latitude tuple) and then predicting the coverage for that service across all structural points of interest that we expect people to live in within the target area. In the case of a local community, these are the locations of household structures. Advances in the availability of high resolution satellite imagery and machine learning based feature identification methods have made household structures available at the global scale. For example, in 2019 the Microsoft Bing team released 18 million building footprints in Uganda and Tanzania [1]. Over time we can expect to know where all people in a community live via satellite imagery, establishing an accurate and complete population to model and predict across. To make True Cover successful, we are bringing these two innovations together, then packaging and operationalizing them for use in the communities that can benefit most from them.
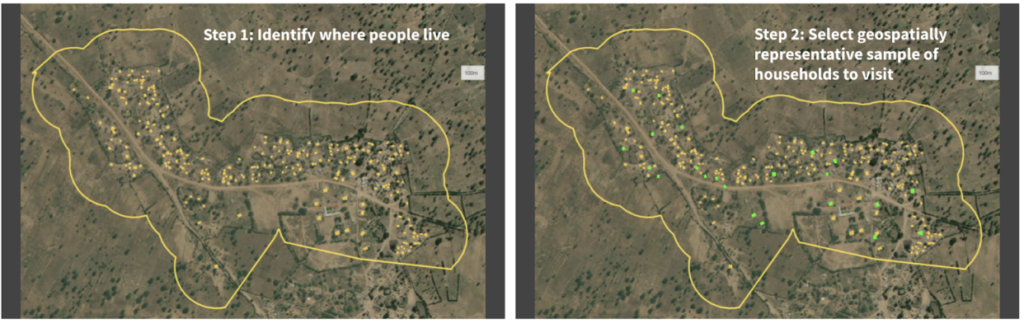
Figure 2: Given a set of unsampled points of interest (e.g. households) and a chosen geographical area (i.e. catchment area), the left panel shows all the households in that catchment area tagged for analysis. The right panel shows the True Cover algorithm selecting the set of households to sample, which it predicts will lead to the highest increase in prediction accuracy.
The resulting steps of the True Cover algorithm are:
GIVEN high resolution satellite imagery, OUTPUT household labels for where community members live,GIVEN household labels AND optional known data on households AND an adaptive spatial sampling method, OUTPUT a spatially distributed sample of households to collect data from,GIVEN coverage data on household labels, OUTPUT estimates and confidence for all households,GOTO STEP 2.
We then developed a task based data collection approach, on top of OpenSRP, to allow health workers to download and view all structures on a map and collect data on the structures they are assigned to visit. Using the OpenSRP app they can easily navigate to the house they are assigned to — indicated by color-coding the structure green — and collect data related to coverage. In the case of immunization, this is the number of children at the household who are up-to-date on their immunizations or fully immunized.
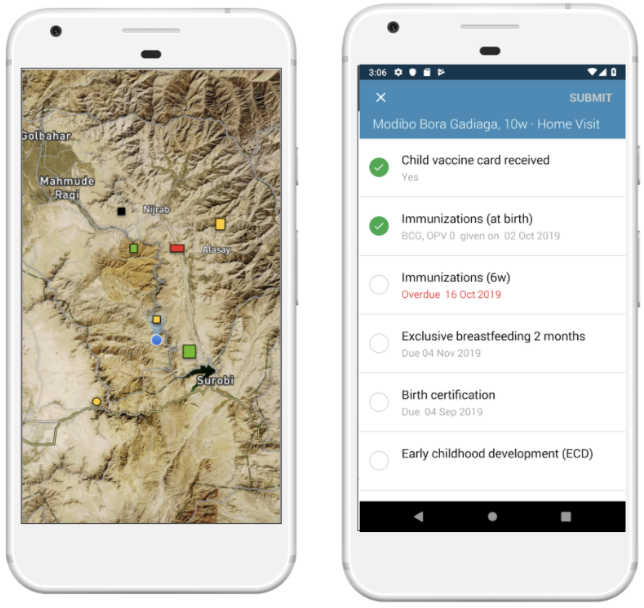
Figure 3: The OpenSRP 2 app shows POIs overlayed on high-resolution satellite imagery. OpenSRP 2 color-codes POIs to guide the user toward where to collect data and updates the color-coding based on users’ completed forms linked to POIs. All OpenSRP 2 configurations and data are FHIR-native.
The collected observations are fed into True Cover, which combines these new observations with previously collected observations to update the predicted coverage across all structures in the community, both those with and without observations. When visualized, this produces an intuitive coverage map that makes it easy to identify problem areas. Because True Cover is an active learning model, the accuracy of its predictions improve as more observations are added.

Figure 4: Left panel shows structures color-coded by True Cover’s prediction of the likelihood of household members being fully immunized (coverage). Right panel shows those same structure color-coded by True Cover’s confidence in its coverage estimates.
One of its key features is True Cover’s ability to calculate the confidence of each prediction it makes. The right panel in Figure 4 shows both the areas where the model is able to predict with high confidence, and the areas where more data is needed to improve the prediction. The model’s confidence scores are an input to the adaptive sampling approach, which selects the locations to collect data from that will provide the greatest increase to the model’s overall predictive accuracy. This adaptive sampling approach is more efficient compared to random sampling because it requires less data collection to achieve an equivalent improvement in accuracy. Less data collection leads to greater impact, e.g. increase in vaccination coverage rates, with less time and money spent.
Validating True Cover
Our original goal was to field test the full True Cover methodology in a pilot site. However, we were unfortunately unable to due to delays in project site approval and the reprioritization of community efforts towards COVID-19 prevention through testing and vaccination. As a result, we found opportunities to validate the model across a number of different use cases with projects that could make their existing data available to us.
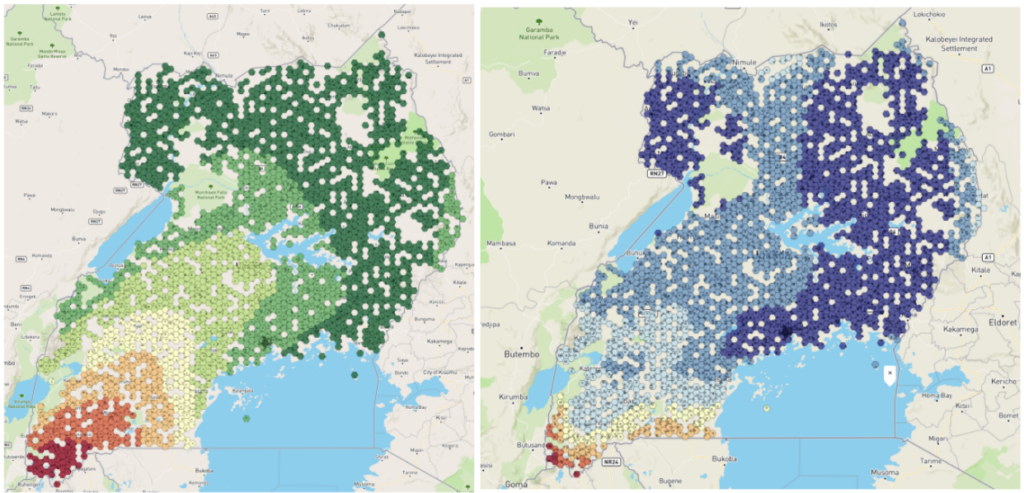
Figure 5: Left panel shows the BCG vaccination coverage estimates in Uganda generated by True Cover. Right panel shows confidence in BCG vaccination coverage estimates.
Using publically available Bacillus Calmette–Guérin (BCG) data we were able to generate a BCG coverage and confidence map for Uganda. This map shows lower coverage in south western Uganda up to the border, and generally lower confidence in the predictions along borders. This would align with demographic data showing that wealth is more concentrated in larger cities, such as Kampala, in central Uganda, and the sparser data available near the borders.
Working with a research partner in Bangladesh, we were able to use True Cover to predict antenatal care coverage rates, which interestingly were found to correspond with maternal middle upper arm circumference (MUAC) classifications from a different data source. This also shows the expected pattern of lower coverage rates closer to the Brahmaputra river, where people are more economically disadvantaged.
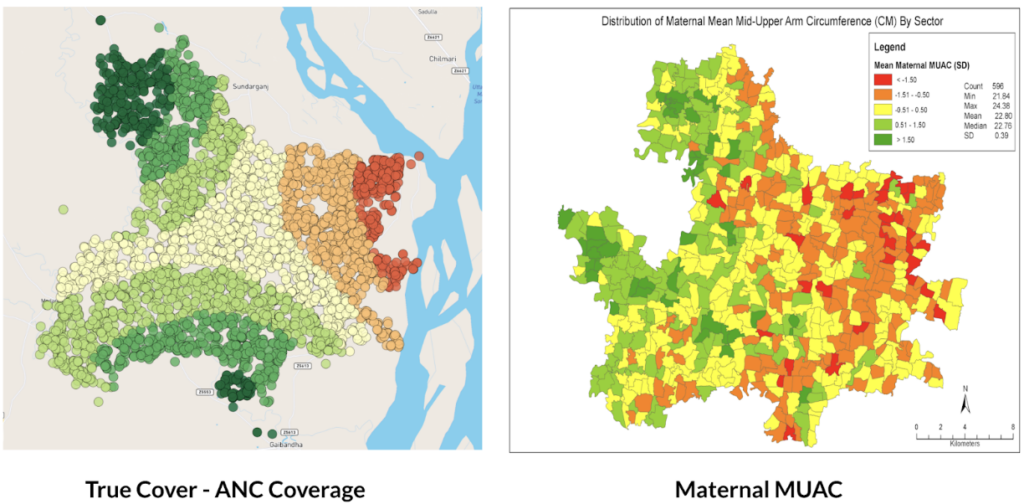
Figure 6: Left panel shows True Cover’s prediction of antenatal care coverage in the area studied in Bangladesh. Right panel shows the average maternal MUAC score aggregated by sector (the finest-grained administrative boundary) in the same area.
Why current approaches to measuring coverage fail
We set out to develop a methodology and set of supporting analytical and data collection tools that enable health teams to better visualize service coverage (e.g. immunization coverage) at the community level. Our goal with True Cover is to enable communities to develop strategies to improve health equity by helping them better understand where problems in their community lie.
True Cover addresses some of the challenges inherent in measuring and estimating coverage at the community level. Most methods of estimating service coverage rely on denominators based on target populations. As coverage rises, however, coverage estimates become increasingly sensitive to errors in target population estimates [2]. For example, a 10% error in the target population estimate of 90% coverage, would lead to a coverage range from 81% – 99% (because 10% of 90% equals 9%) whereas the corresponding error range when estimating at 50% coverage would be from 45% – 55%. Additionally, population estimates are largely based on five to ten year old census data and are often incorrect, sampled at too high an administrative level (e.g. district level), and are sensitive to factors like human migration, which is more prevalent in at-risk and marginalized communities.
To circumvent these denominator challenges, demographic and health surveys (DHS) and multiple indicator cluster surveys (MICS) are used. These methods are very expensive and are only able to provide an accurate snapshot of coverage once every several years. These surveys are sampled to provide accurate coverage estimates at national and sub-national levels (e.g. district or sub-district). If you are a nurse at a health facility, this will only provide a general sense of immunization coverage within their area. They will not know if local coverage is higher or lower over time, or be able to visualize the heterogeneity of coverage within their communities. Their ability to improve coverage is fundamentally a visibility problem. If we can empower them to see where in their community people are more likely to miss vaccinations, they can target those areas and improve coverage.
Applying True Cover to save lives
With True Cover we have successfully built the technical foundations to generate on demand predictive coverage maps capable of playing an active role in guiding vaccination, resource distribution, and other campaigns. This integrates with the OpenSRP 2 app’s task-based data collection approach, which links tasks to household structures and has been successfully used to coordinate the spraying of hundreds of thousands of homes during indoor residual spraying (IRS) campaigns. Further field testing of the system is required to demonstrate True Cover’s value with campaign based apps and validate the effectiveness and utility of the True Cover approach to estimating coverage.
That said, our partners have already found the predicative coverage maps generated by True Cover useful in their decision making. One of our research partners in Bangladesh has used True Cover to spur important discussions, including programmatic changes. While we wish we had been able to go further to validate this approach, we are excited to see that the ability to spatially sample points using the True Cover algorithm has proven useful on its own.
As the frequency of geospatial monitoring and the power of spatial machine learning continue to increase, we are increasingly convinced in the underlying value of the Ture Cover. We are excited and committed to pursuing it further. If you are interested in focusing the power of AI on increasing childhood vaccination rates and preventing malaria, please reach out to us, biz@ona.io.
Acknowledgements
This work was made possible with the support of the Bill and Melinda Gates Foundation, Johnson and Johnson, and the Goldsmith Foundation.